An Overview of Indian Derivatives Markets
The National Stock Exchange of India Limited (NSE) commenced trading in derivatives with the launch of index futures on June 12, 2000. The futures contracts are based on the popular benchmark Nifty 50 Index. The Exchange introduced trading in Index Options (also based on Nifty 50) on June 4, 2001. NSE also became the first exchange to launch trading in options on individual securities from July 2, 2001.
Futures on individual securities were introduced on November 9, 2001. Futures and Options on individual securities are available on 194 securities stipulated by SEBI. The Exchange has also introduced trading in Futures and Options contracts based on Indices. Currently, Derivatives on NIFTY 50, Nifty Bank and FINNIFTY are available for trading.
Nifty 50 – The NIFTY 50 is a diversified 50 stock index accounting for the largest sectors of the Indian economy. It is used for a variety of purposes such as benchmarking fund portfolios, index based derivatives and index funds.Nifty 50 can be used for a variety of purposes such as benchmarking fund portfolios, launching of index funds, ETFs and structured products. It is one of the world’s most actively traded contracts.
Bank Nifty – Bank Nifty includes the most liquid and large capitalised banking stocks on the National Stock Exchange (NSE). It is a benchmark used by investors and market intermediaries to understand the performance of Indian banking.
Expiry day Mechanism of Index/stock Options: In Indian stock exchanges, the last Thursday of every month is an expiry date for monthly futures and options for Index and stocks. Traders must settle their positions before that date. In recent times, both Nifty and Bank Nifty indices also have a weekly expiry date — they expire every Thursday, If derivatives are closed on Thursday, then the expiry day becomes the previous trading day. Whereas FINNITY expires on Tuesday of every week. If Tuesday is a trading holiday, contracts will expire on the previous trading day.
Out of the money options – An out of the money call option has a strike price that is higher than the current market price of the underlying asset. For example, if NIFTY spot is trading at 18,500, 18,700 CE will be considered as OTM call option and 18,400 CE would be considered in the money because it has intrinsic value. Alternatively, an out of the money put option has a strike price that is lower than the current market price of the underlying asset. Out of the money options still have time (extrinsic) value. This is because there is some probability that the option will finish in the money come expiration. Thus, with more time there are more chances for underline to move favourably.
Theta decay of options – The term theta refers to the rate of decline in the value of an option due to the passage of time. It can also be referred as the time decay of an option. This means an option loses value as time moves closer to its maturity, as long as everything is held constant. Theta is generally expressed as a negative number for long positions and as a positive number for short positions. It can be thought of as the amount by which an option’s value declines every day.
Nifty Average Daily Movement– For the intraday Nifty average range hovers around 150-200 points high or low.
Nifty Circuit breakers – A circuit breaker in stock market is of two types i.e. upper circuit and lower circuit. The upper circuit is a maximum range in which a stock can move on a daily basis whereas the lower circuit is a minimum range in which a stock can move on a daily basis.
The index-based market-wide circuit breaker system applies at 3 stages of the index movement, either way viz. at 10%, 15% and 20%. These circuit breakers when triggered bring about a coordinated trading halt in all equity and equity derivative markets nationwide. The market-wide circuit breakers are triggered by movement of either the BSE Sensex or the Nifty 50, whichever is breached earlier. Exchange shall compute the Index circuit breaker limits for 10%, 15% and 20% levels on a daily basis based on the previous day’s closing level of the index rounded off to the nearest tick size.
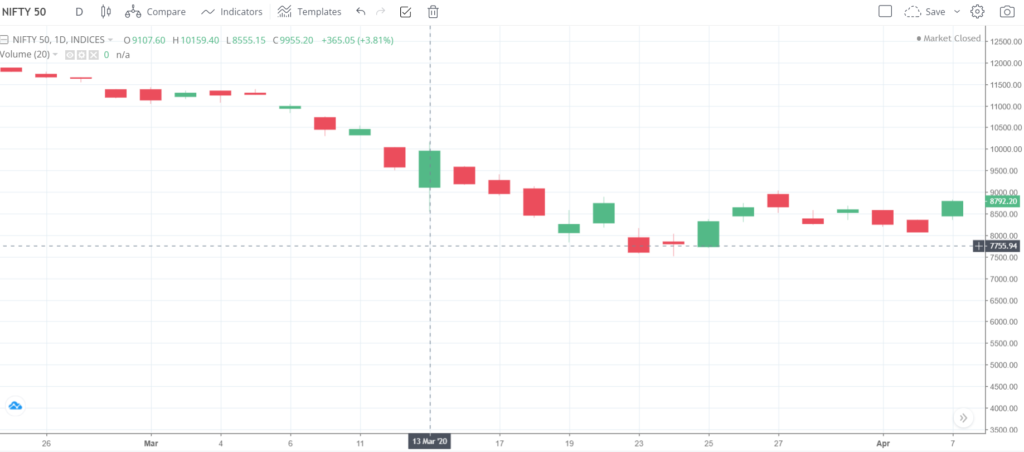
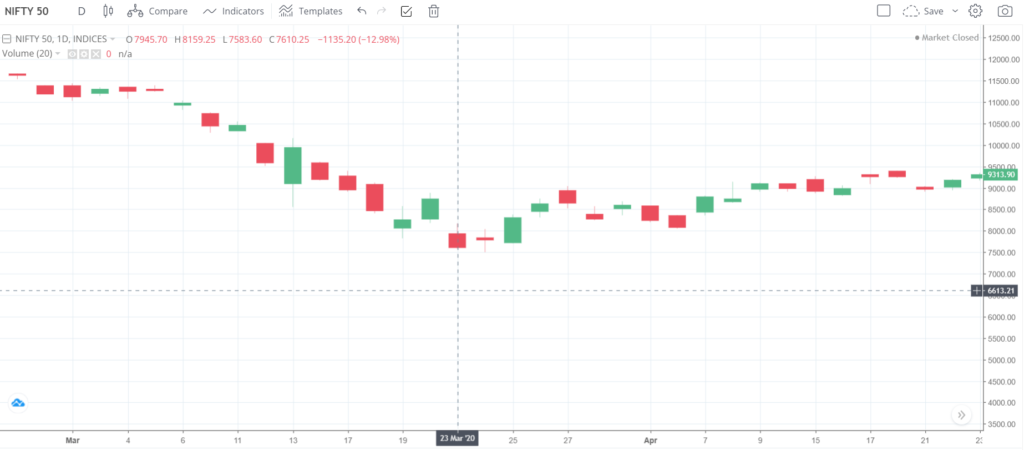
These circuit breakers when triggered bring about a coordinated trading halt in all equity and equity derivatives market nationwide. In recent time Indian market has hit the lower circuit for the first time in 12 years after January 21, 2008 crisis. The trading activity on BSE Sensex and Nifty Bank has also been halted. The Sensex shed 3,090.62 points (or 9.43%) at 29687.52, and the Nifty was down 966.10 points (or 10.07%) at 8,624.05 in morning trade on March 13.

Lower Circuits




Major Falls between 2000-2008
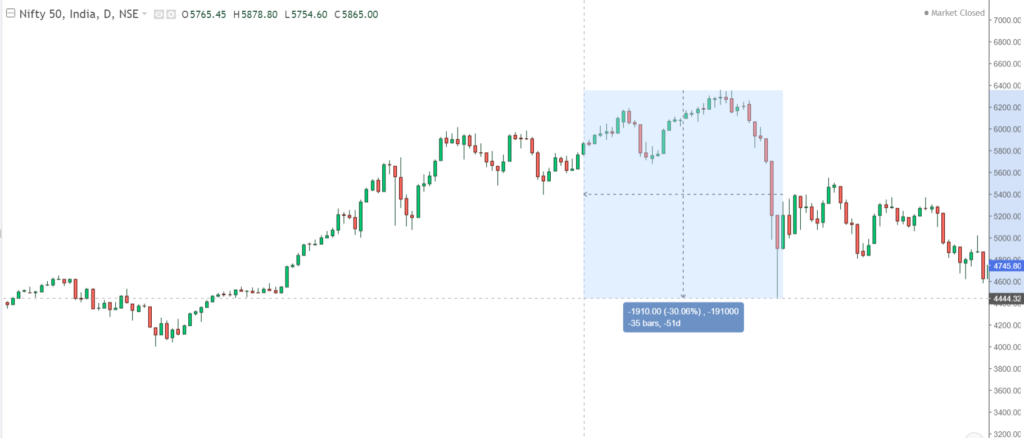
The market witnessed a huge run-up from the year 2000. Nifty went up from 1482 in January 2000 to 6357 in January 2008, thereafter retracing to levels of 2250 (around 64% down from the highest price) in October 2008. During this period two major dates on which market corrected sharply were:
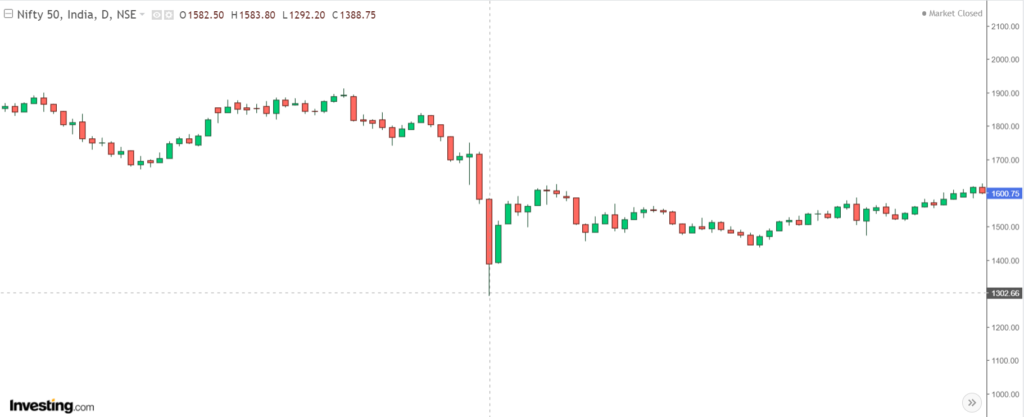
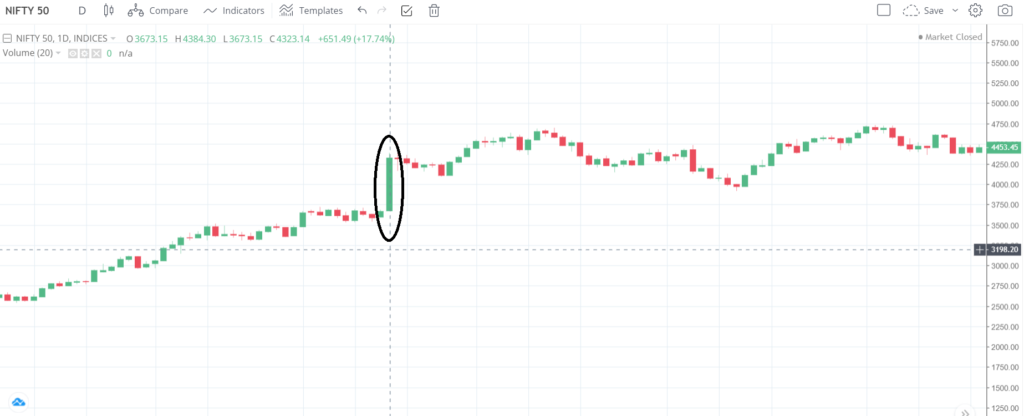
Nifty opened at 1582.5 and touched a low of 1292.2, shedding almost 18% in a single day
